
Rancho Cordova Rental Property Trends: Availability, Rents, and Demand

The Rancho Cordova rental property market trends for 2026 also show average rent running 24.95% above the national average of $2,000. The local rental market was classified as cool, giving renters and property owners a different set of conditions to weigh than a tight, fast-moving market.
That mix can make it difficult to judge whether a listing is competitively priced or whether rental income can cover a property’s costs. Asking rents, available homes, neighborhood differences, and operating expenses all matter, so a single average cannot tell the whole story.
This guide explains local rents and availability, compares Rancho Cordova with national benchmarks, and puts affordability, renter demand, competition, and cash-flow estimates into practical terms. Use it to assess the market before pricing, renting, or evaluating a property in Rancho Cordova and nearby Sacramento-area communities.
Table of Contents
How many available rentals are there in Rancho Cordova, CA?
Rancho Cordova had 187 available rental listings in 2026.
Compared with nearby suburbs, Rancho Cordova’s average rents fall between lower- and higher-rent markets. The city’s rental market was classified as cool, a useful indicator to consider alongside housing availability when assessing competition.
Bedroom count and neighborhood also shape the long-term rental picture. Average apartment rents were $1,368 for a studio, $1,400 for one bedroom, $1,823 for two bedrooms, and $2,695 for three bedrooms. The four-bedroom average was $2,563.
These figures show why it matters to compare similar homes. The average for a three-bedroom apartment may not reflect the rent for a single-family home. Neighborhood, condition, and property type also affect asking rent. Treat bedroom averages as a starting point, then compare listings with similar features in similar locations.
Rents increased by $14 month over month and $142 year over year. The average was $2,236 in January 2026 and $2,547 in October 2026, reflecting a changing market rather than a uniform rise across every home.
For rent increases, market movement alone doesn’t determine what a landlord may charge; applicable requirements and tenancy terms matter. According to California Legislature, California law caps security deposits at one month’s rent for nearly all residential properties. According to California Legislature, California’s 2026 rules extend the tenant response time for evictions to ten days.
Mortgage rates also affect demand and homeowner mobility. The average 30-year fixed mortgage rate was around 6.04% in early 2026, while experts projected U.S. rates between 5.75% and 6.3% in 2026. Rates had peaked above 7% earlier in the cycle, and as of September 2026, about 75% of California homeowners had rates below 5%.
That gap can discourage owners from moving. A California homeowner moving to a similarly priced home after selling with a 5% mortgage rate would face monthly payments approximately 17% higher. When buying feels less accessible, rental housing can remain an important option for households weighing their next move.
Investor suitability and cash-flow considerations
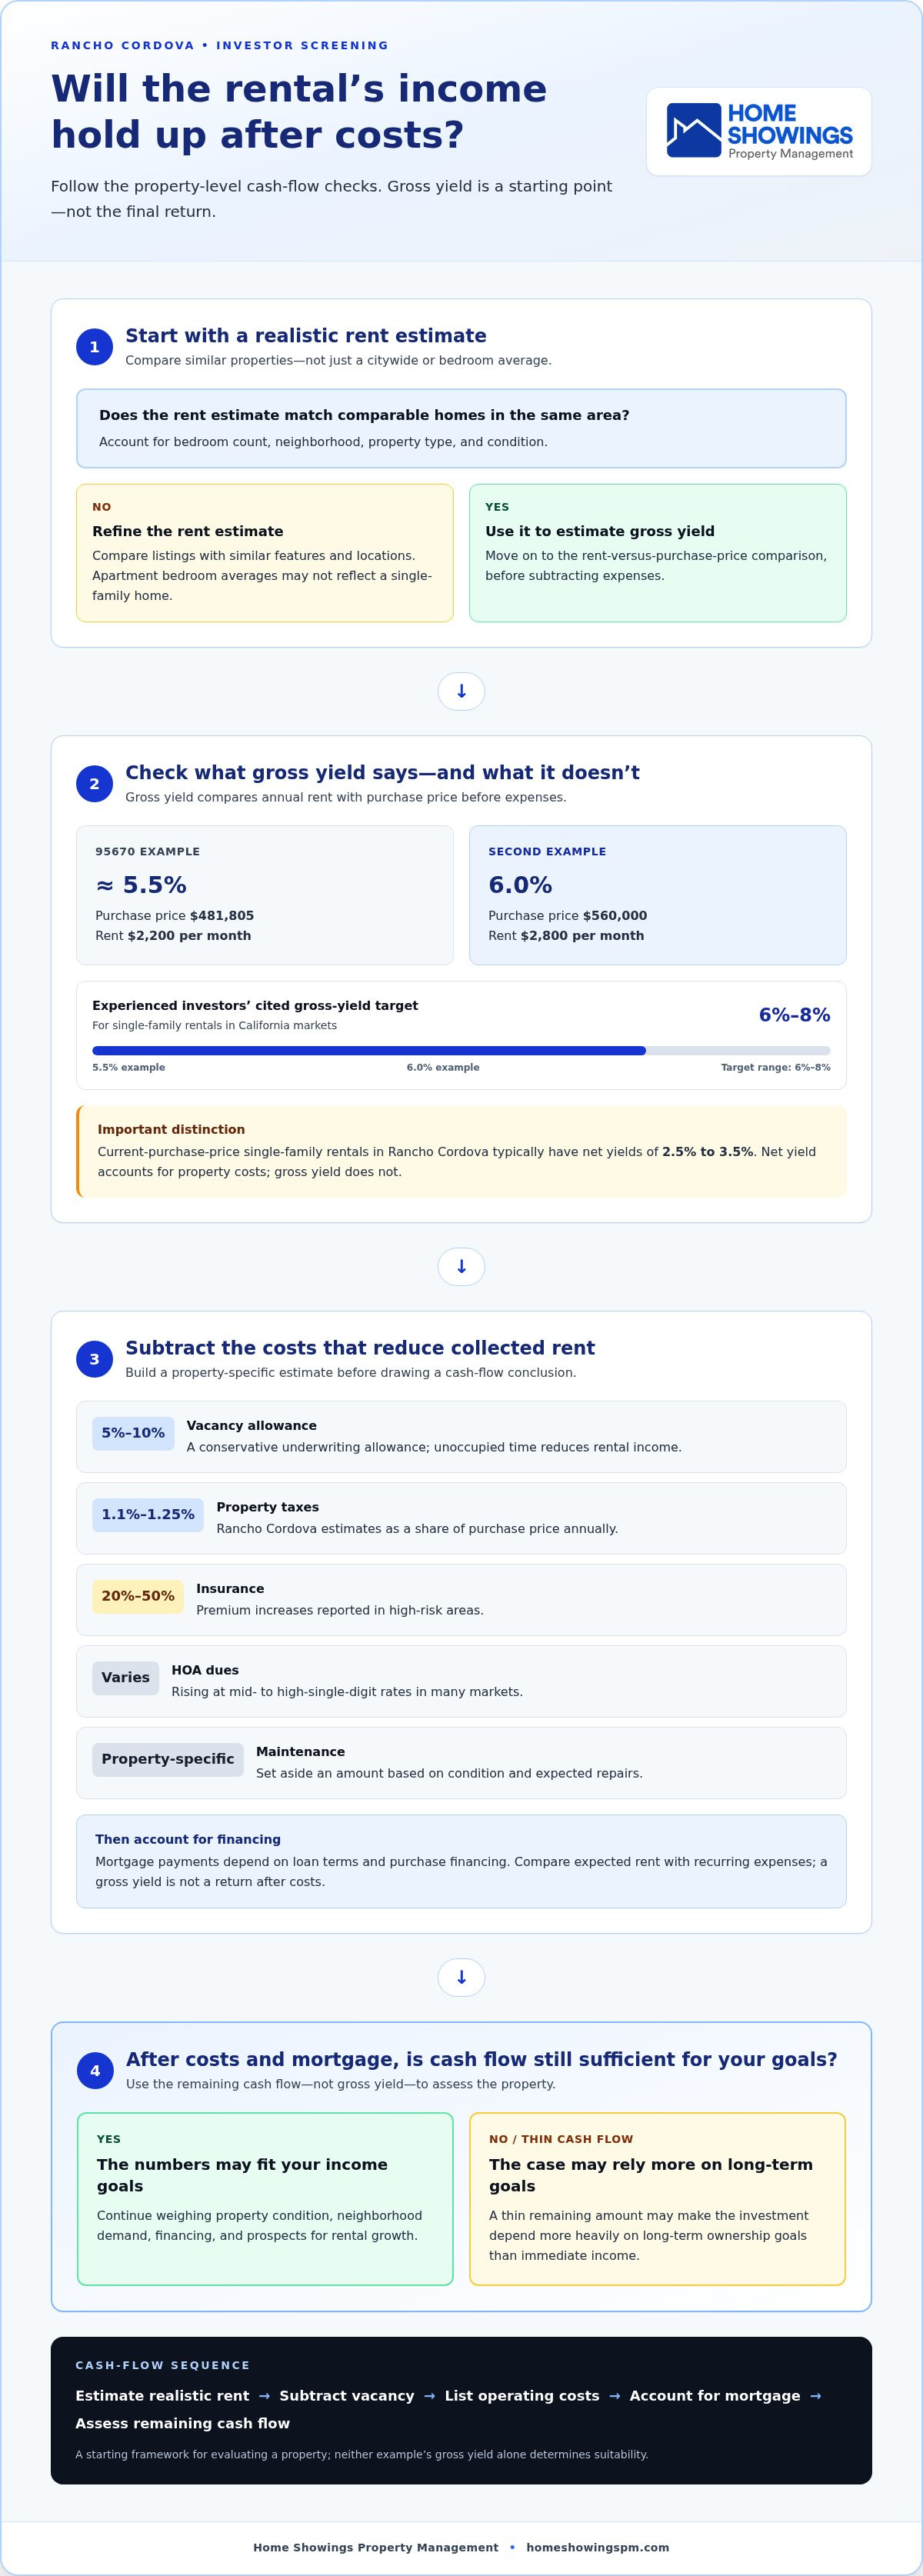
Rancho Cordova rental property market trends 2026 matter most when owners test a property’s income against its costs. A three-bedroom single-family rental in the 95670 zip code, purchased for $481,805 and rented for $2,200 per month, has an estimated gross yield of approximately 5.5%. Another example, a home purchased for $560,000 and rented for $2,800 per month, produces an estimated gross yield of 6.0%.
These examples provide a starting point, not a cash-flow conclusion. Gross yield compares annual rent with purchase price before expenses. Net yield accounts for property costs, and Rancho Cordova single-family rentals at current purchase prices typically have net yields ranging from 2.5% to 3.5%. Owners should model both figures before deciding whether a property fits their income goals.
Build a property-level estimate by accounting for costs that reduce collected rent:
Vacancy: A conservative underwriting allowance is 5% to 10%, since unoccupied time reduces rental income.
Property taxes: Rancho Cordova estimates range from 1.1% to 1.25% of purchase price annually.
Insurance: Premium increases of 20% to 50% have been reported in high-risk areas.
HOA dues: These have been rising at mid- to high-single-digit rates in many markets.
Maintenance: Set aside a property-specific amount based on condition and expected repairs.
Those costs change the result materially. A 5.5% gross yield isn’t a 5.5% return after vacancy, taxes, insurance, maintenance, and financing. The mortgage payment also depends on loan terms and purchase financing, so compare expected rent with recurring expenses before making an offer.
Investor fit depends on priorities. Experienced investors typically target a 6% to 8% gross yield for single-family rentals in California markets. The $560,000 purchase example reaches a 6.0% gross yield, while the 95670 example falls below that target range. Neither figure alone determines suitability. Owners also weigh property condition, neighborhood demand, financing, and prospects for rental growth.
Use a simple screening sequence: estimate realistic rent, subtract a vacancy allowance, list operating costs, then account for mortgage payments. If the remaining cash flow is thin, the investment may depend more heavily on long-term ownership goals than immediate income. For investors evaluating Rancho Cordova rental property market trends 2026, an owner and tenant portal can support an organized rental process, while clear records help owners monitor income and obligations.
Market competitiveness and multiple offers
Rancho Cordova’s housing market showed mixed signals in Cordova Meadows during September 2026. Some homes attracted offers above asking, while neighborhood sale data also showed longer marketing times and a lower sale-to-list ratio. For buyers and rental-property investors, those figures suggest evaluating each property rather than assuming every home faces the same competition.
In Cordova Meadows, 30.7% of homes sold above list price in September 2026, down 2.6 percentage points year over year. Hot homes could sell for about 2% above list price and go pending in around seven days. By contrast, the average home sold for about its list price and went pending in around 15 days, calculated over the last 12 months. The difference between a hot listing and a typical one matters when setting an offer strategy.
Other September indicators reinforce that varied picture. Home-sale activity in Cordova Meadows can vary from year to year. Homes had a median of 32 days on market, 16 days longer than a year earlier. The sale-to-list price ratio was 96.9%, down 2.5 percentage points year over year.
These measures track different things. A rising median sale price can coexist with a falling price per square foot because the homes sold may differ in size, condition, or features. Similarly, more sales do not automatically mean every listing receives multiple offers. In Cordova Meadows, the median 32-day marketing period and 96.9% sale-to-list ratio provide context beyond the share sold above asking.
Price movement also depends on the comparison period. Cordova Meadows home prices increased 4.4% over the three months ending September 2026 compared with the same period in 2025. That short-period change sits alongside the annual neighborhood figures, but it shouldn’t be treated as a forecast for every property or future sale.
For a practical offer review, compare recent nearby sales, asking price, days on market, and property condition. Then set a maximum purchase price that still fits the rental plan. A listing pending quickly may call for a prepared offer, while a home marketed longer may leave more room to assess repairs and negotiate. Sacramento-area new listings increased 8% in 2025 compared with 2024, with most of that increase in the first half. That broader supply trend provides context, but Cordova Meadows figures are more specific to the neighborhood and period.
Affordability and renter demand
That citywide measure provides a broad affordability reference, but renters compare individual listings by size, location, and condition. For owners, those same factors help determine whether an asking rent fits local budgets and is likely to attract qualified interest.
The rent-versus-buy gap helps explain the continuing importance of rental housing. A difference in monthly payments can make renting more accessible for households that cannot manage the costs of ownership.
Across California, monthly home payments for a two-bedroom property were about 66 percent higher than rent for a similar home in September 2026. Since January 2020, the ratio of home payments to rent increased in 36 of the 48 counties with available data. These measures point to a sustained affordability challenge, though household choices still depend on income, location, and housing needs.
Rancho Cordova also faces a longer-term supply concern. The projected housing deficit in the 95670 zip code is 1,870 units by 2030. A potential shortage can add pressure to the local housing market if household demand grows faster than available homes. It doesn’t mean every rental listing will lease quickly, since price, condition, and location still shape renter response.
Renters should compare the full monthly housing cost, not just the advertised rent. Owners reviewing an asking price should consider the home’s features and likely tenant pool before making changes. Factors affecting affordability include:
Monthly budget: Rent competes with other household costs, including utilities and transportation.
Property condition: A well-maintained home may offer stronger value than a lower-priced listing needing repairs.
Ownership expenses: Mortgage payments, property taxes, maintenance, and insurance affect an owner’s costs, not a renter’s advertised rent.
Household needs: A renter’s preferred location, space, and lease terms can narrow suitable options.
These details help explain why average rent alone can’t measure demand. A listing priced beyond comparable options may reach fewer renters, while a home that fits household budgets and needs can appeal to a broader pool. With the 95670 housing deficit projected by 2030, affordability and supply remain important considerations for Rancho Cordova real estate decisions.
Comparison with the national average
In 2026, average rent in Rancho Cordova was 24.95% higher than the national average of $2,000. That difference matters for renters comparing budgets and owners considering local asking rents. A national benchmark gives useful context, but it doesn’t replace comparisons between similar homes, neighborhoods, and lease terms.
Local and national figures describe different markets. Rancho Cordova’s average rent reflects local listings and housing costs, while the national figure combines areas with different incomes, housing types, and supply conditions. When comparing a Rancho Cordova home with one elsewhere, consider bedroom count, condition, location, and included features as well as monthly rent.
For owners, a rent above the national average does not automatically mean a property can command more. The asking price still needs to match the home’s features and nearby alternatives. Compare similar properties, then consider whether the monthly cost fits the intended renter’s budget. A citywide average is a reference point, not a pricing formula.
National supply conditions also offer context. U.S. housing inventory increased by nearly 9% year over year at the end of 2025. More available homes can broaden choice for buyers, but this national trend doesn’t establish how many rentals are available in a particular Rancho Cordova neighborhood. Local rental availability and national for-sale inventory measure different parts of the housing market.
Price expectations offer another comparison. Most forecasts projected low single-digit U.S. home price growth in 2026. That forecast concerns home prices, not rents, so it shouldn’t be used as a direct estimate of future rental income. For an investor, keeping those measures separate helps avoid treating a national home-price outlook as proof of local rent growth.
A practical comparison can follow three steps:
Set the benchmark: Compare Rancho Cordova’s average rent with the national average, while noting each figure’s market scope.
Match the property: Review homes with similar bedroom counts, condition, and locations before judging an asking rent.
Separate market measures: Treat rental prices, available rental listings, housing inventory, and home-price forecasts as distinct indicators.
This method makes the 24.95% local premium more useful. It tells readers that Rancho Cordova rents sit above the national average, while the listing-level comparison shows whether a particular home fits its local market. National inventory growth and home-price forecasts add broader context, but neither replaces neighborhood evidence when evaluating a rental or a household budget.
Home Showings Property Management: Property Management
Home Showings Property Management helps rental owners manage the work involved in leasing and maintaining residential properties. If pricing, tenant selection, or rent collection is becoming difficult to handle, its Property Management service brings these responsibilities together.
Rental Marketing presents a property to prospective tenants, while Tenant Screening supports informed applicant decisions. Rent Collection helps owners manage incoming payments, including online payments through the tenant portal. These services can help when preparing a home for rent, finding tenants, or organizing day-to-day leasing responsibilities.
The market figures in this guide can help owners set realistic expectations, but applying them to a specific property takes attention to its location, condition, and rental terms. For support with the rental process, contact Home Showings Property Management.
Turn Market Insight Into Your Next Step
The Rancho Cordova rental property market trends in 2026 are most useful when they inform a clear plan for your property. Consider your priorities before making a move: attracting suitable applicants, selecting tenants carefully, or keeping rent collection organized. A focused approach helps connect local market conditions with the decisions you make as an owner.
Home Showings Property Management offers Property Management, Rental Marketing, and Tenant Screening to support key parts of the rental process. If you’re ready to discuss how those services fit your property goals, contact Home Showings Property Management. A thoughtful next step can help you move forward with greater clarity and confidence.
Frequently Asked Questions
What is the average rent in Rancho Cordova, CA?
A separate October 2026 figure lists an average of $2,547, illustrating how rent measures can differ by dataset and reporting period. For a practical comparison, match the property type and bedroom count, then use the same source and measurement period for each listing you assess.
What are average rents in Rancho Cordova in 2026 by bedroom count and property type?
Average apartment rents were $1,368 for studios, $1,400 for one-bedroom units, $1,823 for two-bedroom units, and $2,695 for three-bedroom units. The four-bedroom apartment average was $2,563. These are apartment averages, not a complete breakdown for every property type. For a single-family home, compare listings with similar bedroom counts, condition, and location rather than applying an apartment average directly.
What is the rental vacancy rate and available rental inventory in Rancho Cordova in 2026?
Rancho Cordova had 187 available rental listings in 2026. A listing count describes advertised supply at a point in time; it isn’t the same measure as a vacancy rate, which compares vacant homes with the total housing stock. To judge conditions for a specific property, consider how comparable listings are priced and how long they remain available, rather than treating the inventory count as a direct vacancy percentage.
What are typical home prices and gross rental yields for Rancho Cordova investment properties in 2026?
Two investment examples show purchase prices of $481,805 and $560,000, with estimated gross yields of approximately 5.5% and 6.0%, respectively. These examples aren’t a citywide home-price average. Gross yield compares annual rent with the purchase price before expenses, so it won’t reflect the amount left after taxes, insurance, maintenance, vacancy, and financing. Use each property’s own expected rent and purchase terms for analysis.
Which Rancho Cordova neighborhoods have the highest rents and strongest rental demand?
Higher rent does not automatically mean stronger demand. To assess a particular neighborhood, compare similar homes, how long they have been listed, and how their prices relate to their condition and location. This gives a more useful local comparison than rent alone.
What tenant demand and renter demographics are shaping the Rancho Cordova market in 2026?
Affordability is a key demand factor: California’s estimated monthly payments for a two-bedroom home were about 66 percent higher than rent for a similar home in September 2026. That difference can lead households to consider renting instead of buying. For an individual rental, the likely tenant pool also depends on layout, location, condition, and asking rent. Match those features to the households the property can reasonably serve.
What property taxes, insurance, maintenance, and landlord costs should Rancho Cordova investors expect in 2026?
Estimated Rancho Cordova property taxes range from 1.1% to 1.25% of purchase price annually. Insurance premium increases of 20% to 50% have been reported in high-risk areas. Maintenance depends on the property’s condition, systems, and repair needs, so inspect those items when estimating operating costs. Include vacancy in the calculation too: a conservative underwriting allowance is 5% to 10% of potential rental income.
What are the main risks and outlook for Rancho Cordova rental property investors in 2026?
Key risks include costs that compress net returns, unoccupied periods, and rent assumptions that don’t match a property’s condition or neighborhood. Net yields on Rancho Cordova single-family rentals at current purchase prices typically range from 2.5% to 3.5%. The projected housing deficit in the 95670 zip code is 1,870 units by 2030, a supply consideration rather than a guarantee of rent growth. Model expenses and income before investing.

Comments